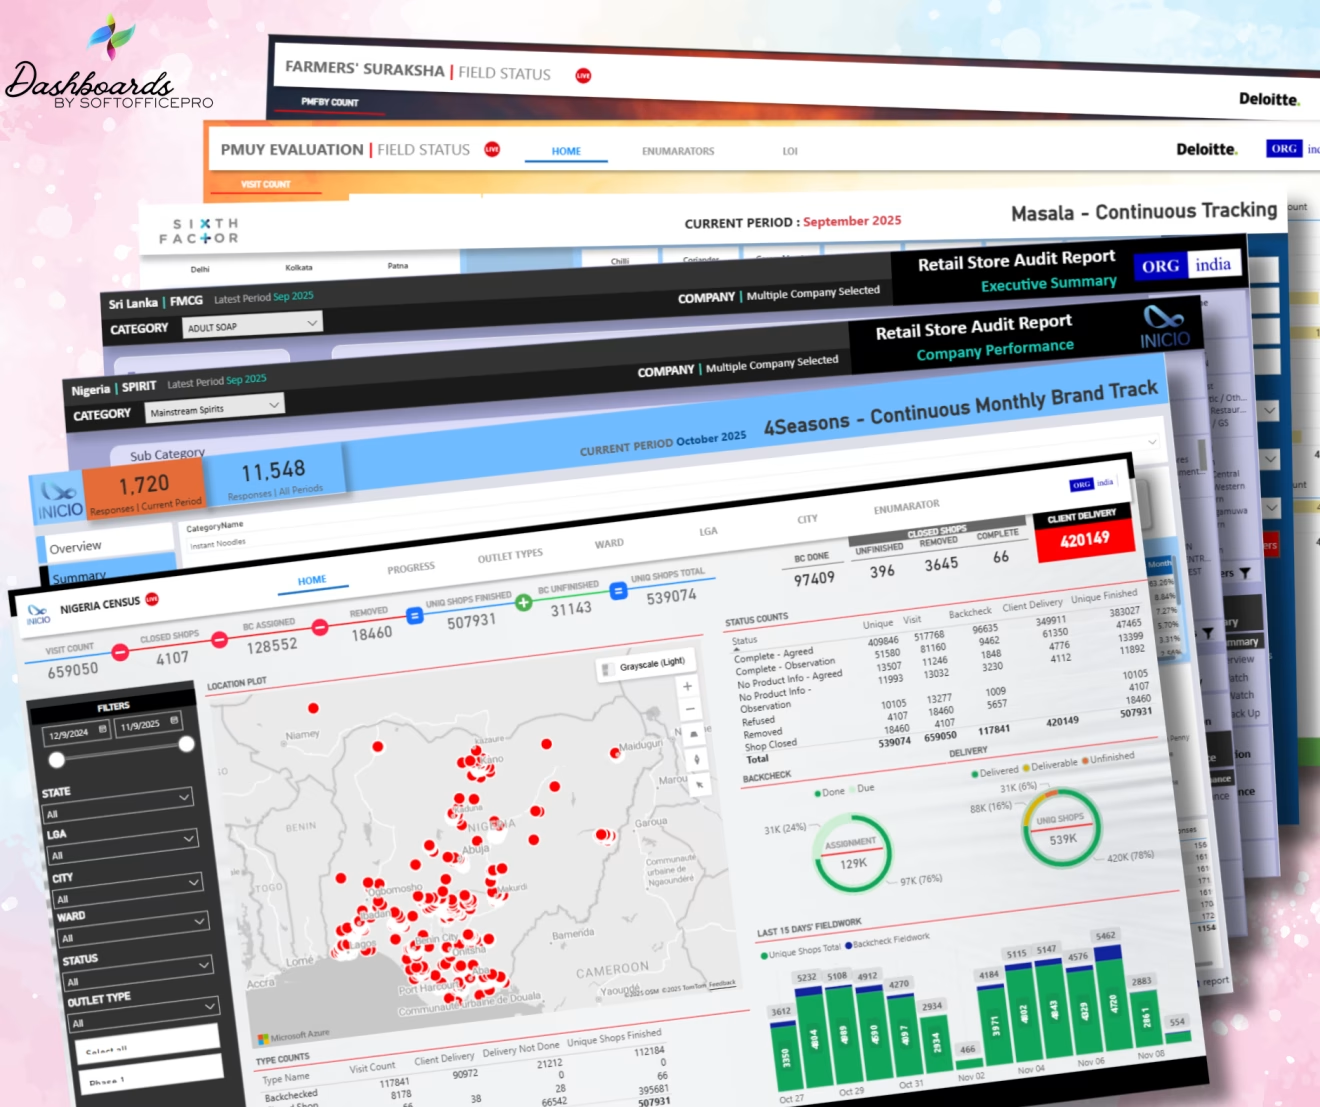
Visualize Data Using Dashboard Service
Transforming Business Intelligence Through Data Visualization. Turn raw data into compelling visual narratives.
7 Essential Benefits to Transform Your Business
Dashboard services transform raw data into compelling visual narratives that enable organizations to make informed decisions quickly and confidently. Whether you’re tracking key performance indicators, monitoring real-time metrics, or analyzing historical trends, a well-designed Power BI dashboard service provides the clarity and insights needed to drive business success.
Power BI Dashboard Service empowers your organization to transform complex datasets into strategic advantages. Explore your data dynamically, drill down into metrics, and uncover hidden patterns.
Key Benefits of Dashboard Services
Real-Time Data Visualization
Enables immediate response to changing conditions, allowing teams to identify opportunities and address challenges as they emerge.
Customizable Interfaces
Ensure that each stakeholder receives the most relevant information in a format that resonates with their specific needs.
Interactive Filtering
Allow users to drill down into specific data subsets, uncovering insights that might otherwise remain hidden.
Automated Reporting
Save countless hours by generating and distributing scheduled reports to relevant stakeholders automatically.
Mobile Responsiveness
Ensures that critical information is accessible anywhere, anytime, empowering decision-makers regardless of location.
Integration Capabilities
Create a unified view of organizational performance by integrating with existing systems and data sources.
Collaborative Features
Enable teams to share insights, annotate findings, and work together seamlessly across departments.
Predictive Analytics
Leverage historical data to forecast future trends and outcomes, enabling proactive rather than reactive business strategies.
Data Security & Governance
Implement robust role-based access controls to ensure sensitive information remains secure and compliant with regulations.

Unlock Your Potential
At SoftOfficePro, we understand that today’s business leaders need more than just data; they need actionable insights delivered through powerful, intuitive visualizations.
Our dashboard service is designed to scale with your business, accommodating growing data volumes and evolving analytical needs. We prioritize security and compliance, ensuring your sensitive business information remains protected through industry-leading encryption.
Executives gain KPI overviews for strategic planning, while analysts access detailed data exploration tools for deep-dive investigations.
Power BI Dashboard Pricing Guide
| Dashboard Type | Complexity | What’s Included | Fair Price Range & Timeline |
|---|---|---|---|
| Basic Report / Quick Fix | Low | Single data source, basic ETL, 1–2 visual pages, simple DAX, no custom visuals. | ₹15k – ₹45k / $180 – $540 Timeline: 2–4 days |
| Standard Operational Dashboard | Medium | 2–4 data sources, moderate modeling, 3–5 pages, standard DAX, basic parameterization. | ₹45k – ₹90k / $540 – $1,080 Timeline: 5–8 days |
| Advanced Business Dashboard | High | 5+ sources, complex modeling, 6–10 pages, Time Intelligence, Power Automate, RLS. | ₹90k – ₹1.8L+ / $1,080 – $2,160+ Timeline: 8–15+ days |
| Enterprise BI Solution | Very High | Data warehouse, real-time streaming, AI analytics, Premium deployment, governance. | ₹1.8L – ₹5L+ / $2,160 – $6,000+ Timeline: 15+ days (Retainer/Ongoing) |
*Monthly Charges are applicable based on the update frequency for ongoing retainers.
Ready to Visualize Your Success?
Contact SoftOfficePro today to schedule a personalized demo or consultation. Revolutionize the way you visualize, understand, and act on your business data.